Better Rails Debugging with better_errors and jazz_hands
Go beyond the stacktrace with 2 gems that grant you debugging superpowers.
Better Errors
Does this screen look familiar? Do you notice anything wrong with this picture?
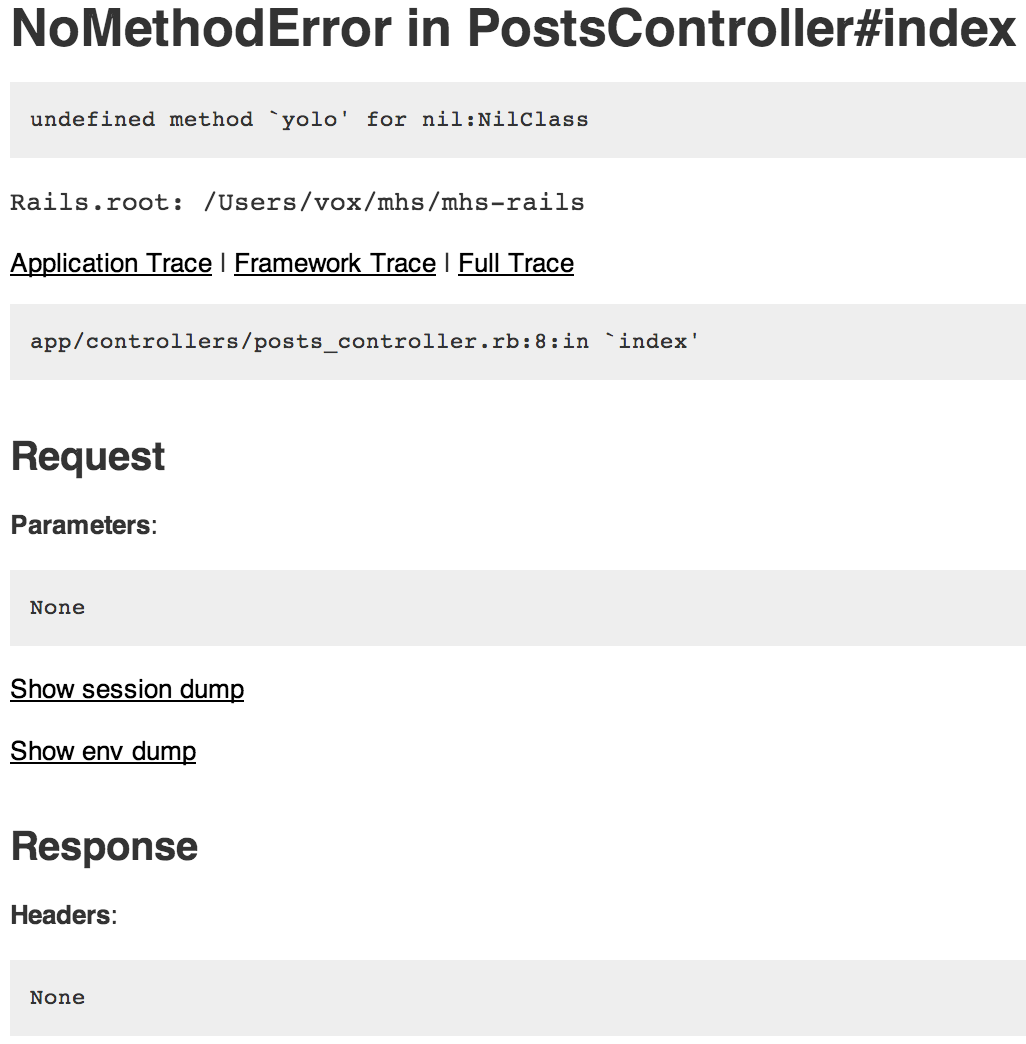
That is correct, that is the default Rails error page and you are absolutely right, it is completely hideous and hurts to look at. It is begging to be improved.
By answering these questions you have already proven yourself to be quite a smart cookie, my dear reader, so you probably can guess what a gem called better_errors does. However, you might not realize just how much of an improvement better_errors actually is.
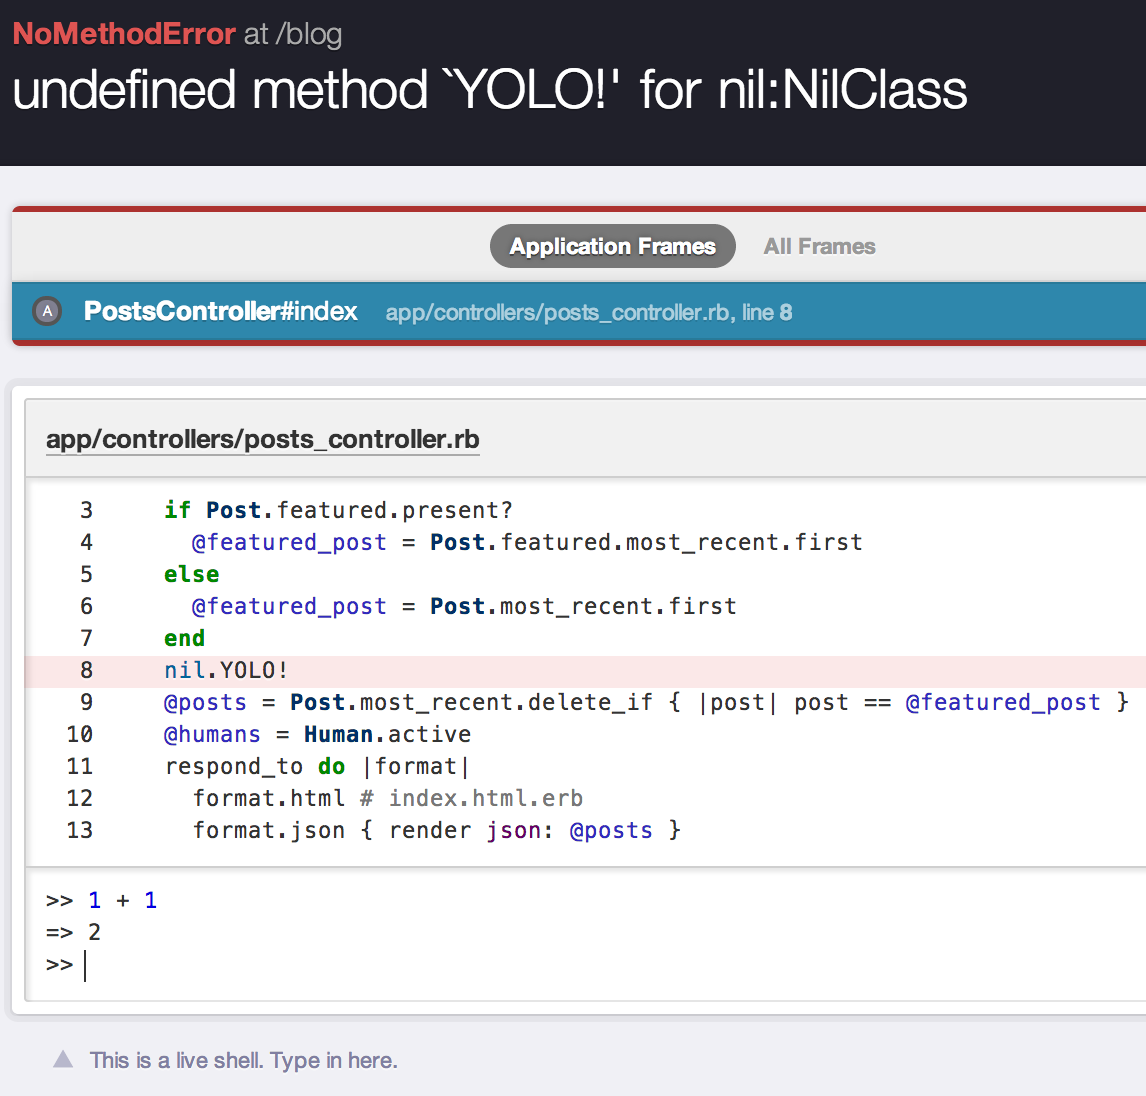
It is clearly more visually appealing, but it also provides much more detailed debug information, as well as providing a REPL for interacting with the code (assuming you have the separate bindingofcaller gem installed).
One of my favorite parts of better_errors is that it filters application frames in the stacktrace, so when debugging you can focus (at least at first) on the code you are writing and less on the Rails internals. The flipside of that is that by showing you a little bit of code context, as well as local variables, instance variables, request info, and providing a REPL for the full stacktrace, it is much easier to examine those Rails internals and pick up on that Rails Magic™ going on.
If you are debugging a Rails API, AJAX, want to investigate a non-critical error like missing images, or for any other reason don’t access the error page directly at the time of the error better_errors provides a page accessible via the url “/_bettererrors” which contains the error page for the last error on the server.
Another awesome part of better_errors is that it can open up files in your editor! It comes out of the box with support for textmate, but also supports for vim and a couple other editors. You can add Sublime Text by downloading sublime-handler and configuring an initializer for better_errors that simply contains:
BetterErrors.editor = :sublime if defined? BetterErrors
The error page page is even responsive! This is an extremely polished gem and I simply can’t live without it.
Jazz Hands
When I need to really get my mitts in there and dig around for debugging, I like to use jazz_hands.
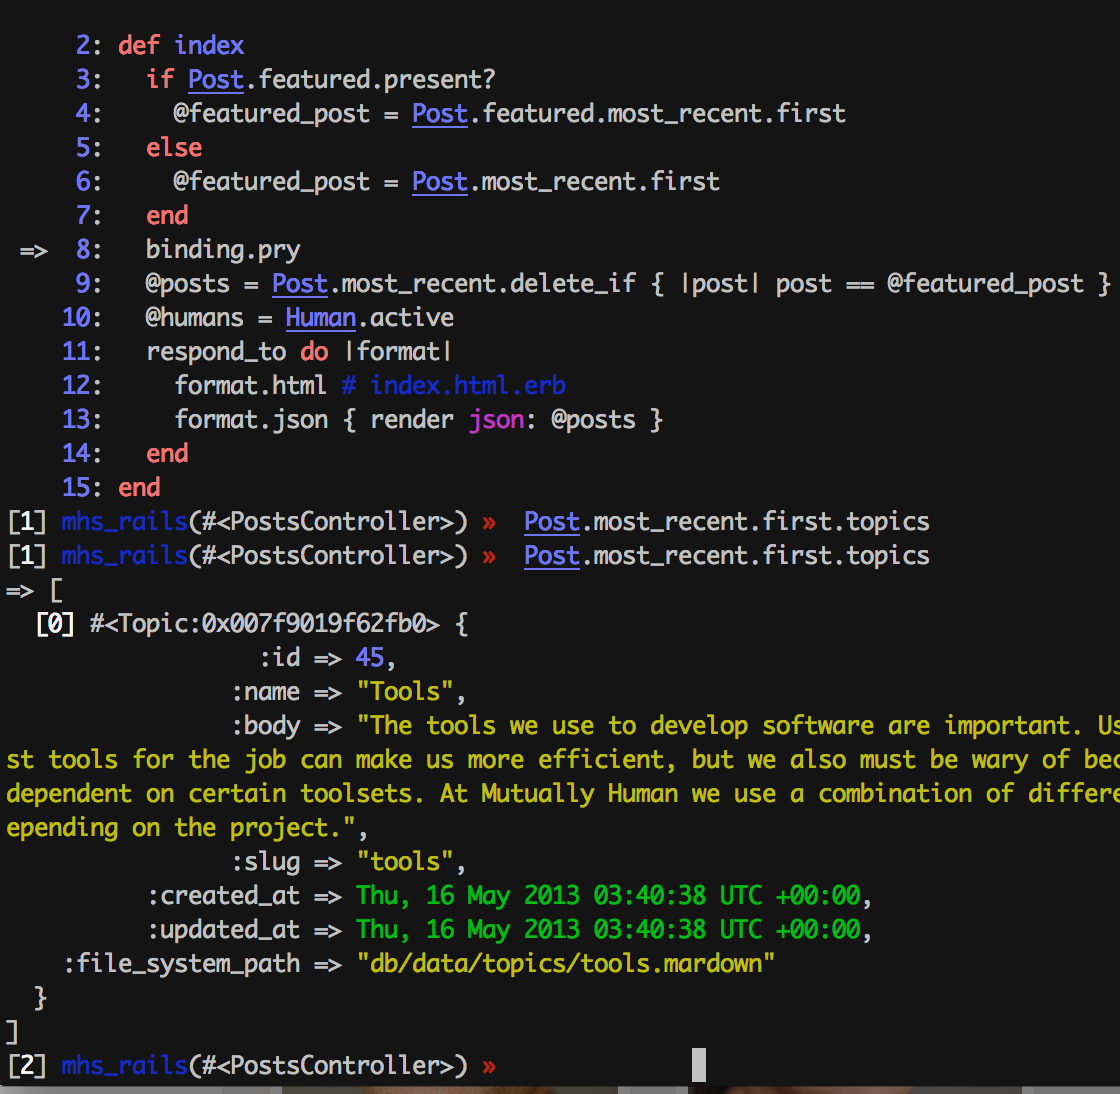
This is not intended to be an exhaustive tutorial on how to debug using pry, but suffice it to say I mostly interact with pry by setting breakpoints with binding.pry in my source code to launch the pry REPL in the terminal running my rails server. better_errors is great at catching exceptions and helping to isolate a problem by showing the stacktrace, but once you know the problem and need to experiment in order to figure out the solution, pry is a much more powerful tool than the REPL provided by better_errors.
The part of the jazz_hands extension that I interact with the most is awesome print. This provides a prettier output in the REPL when getting descriptions of objects and variables. pry-debugger is also great for allowing you to step through the code right from the REPL. pry-rails is great and I find myself using the show-routes functionality frequently.
I have found pry-git to be quite buggy and have not been able to use it successfully. The syntax highlighting as you type technically works, but oddly it causes my cursor to be offset by 10 or so characters to the right, so I don’t use it.
In Conclusion
One of the best things about jazz_hands and better_errors is that they are so simple to set up and have no downsides. These gems are my defaults and are in every single rails project I do. By giving you debugging superpowers these gems can not only be huge time-savers, but they can reduce your stress to add years to your life. Not every gem can say that!
Originally posted on the MHS Blog